|
USING THE DISTRIBUTION MAPS Your browser window 1. When you click on a map icon on the Findings: Table of contents page, the map page opens in a new browser window. You can return to the Findings: Table of contents page by clicking anywhere on its window. 2. Resize your browser window showing the map page to be as big as possible. You could hide the various information bars at the top of your browser (using the "View" menu) to make more space for the main part of the window. |
|||||||||
|
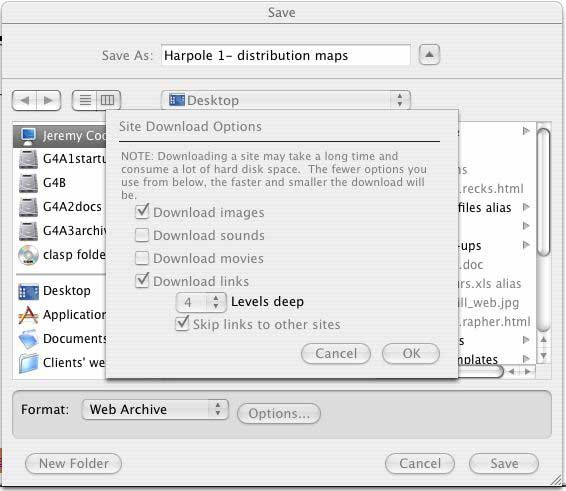
Viewing this web site on-line The maps may take some time to download (up to 30 seconds each depending on your connection). Please be patient. Once downloaded you will be able to call them up quickly to make comparisons. If you are using MS Explorer as your browser, you could make a web archive of each set of maps: go to the first page of each site-map and save that part of the the site as a Web Archive: use "File - Save As - Format:Web Archive - Options" and set the download options like this:
Click "OK" in the Options window, and then "Save" in the Save window, and you will save all the necessary files to your hard drive and be able to view the site off-line, and much more quickly. But be aware that downloading the web archive will take a long time if you are on a dial-up connection. |
|||||||||
|
The maps 1. All of the map pages are formatted using frames. All current versions of common web browsers support the frames format. 2. Depending on the shape of the archaeological site, the map pages take one of two forms:
3. You may need to resize the frames so you can see the vertical scroll bar on the key frame, and so as to lose, or minimise any scroll bars on the map frame. 4. Click on an icon in the key frame to see a full-scale map in the map frame. 5. Click on the full-scale map, or on the words in the grey bar above and/or below a full-scale map, for more data and/or our interpretations, which will appear in the text frame or as a pop-up: the pop-up windows can be resized and moved as desired. If you have a problem seeing the pop-up windows, try switching off any pop-up blocking settings in your browser while you are using this site. 6. Clicking on links or icons in the text frame will put new information in the text frame, or new full-scale maps into the map frame. Interpretation 1. All maps are orientated with North at the top of the screen. 2. Distribution maps show locations of activity. On each map, the symbols represent a hierarchy of the quantity of material recovered from each of the grid squares.
Feedback This web site is being constantly developed and we welcome any feedback about its functionality and content. Please email to jeremy@oliomedia.co.uk |
|||||||||